I was barely past my first tandem jump when I looked at my Garmin watch (Vivoactive HR) and thought, “I should be able to use this to log my skydives”. After all, it has a GPS and built in heart rate sensor (you don’t need to wear an extra heart rate sensor/strap). My first jump my instructor told me to pull the watch, but I wore it for my second tandem jump and thereafter. I figured I could be safe with my watch double latched and under my jump suit.
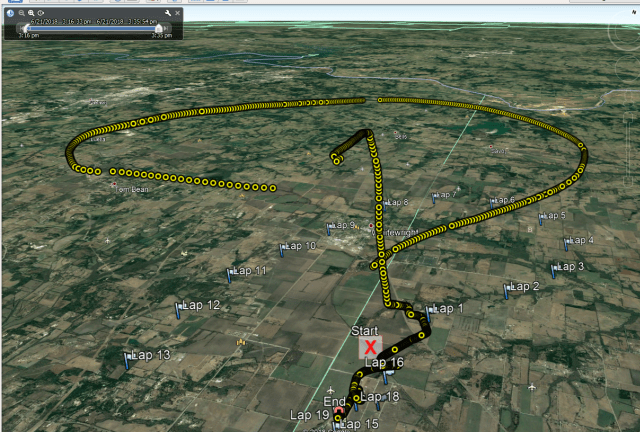
The first time I tried to use my watch, I accidentally put it in “rowing” mode instead of running. I got heart rate and location data, but NO elevation data – bummer. Even that was pretty cool for me to look at and see an overhead, flat earth view of the path.
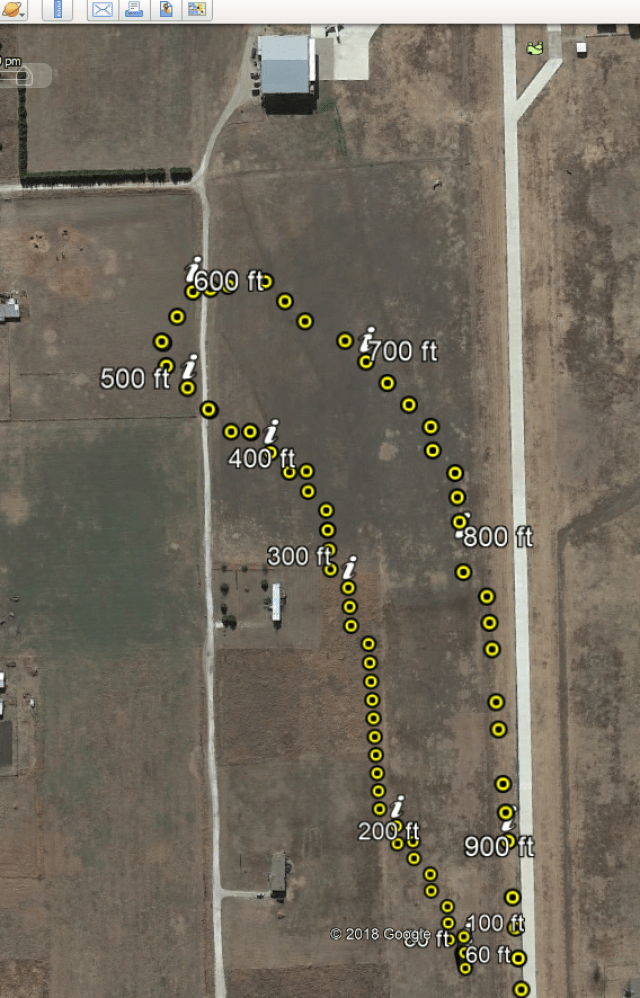
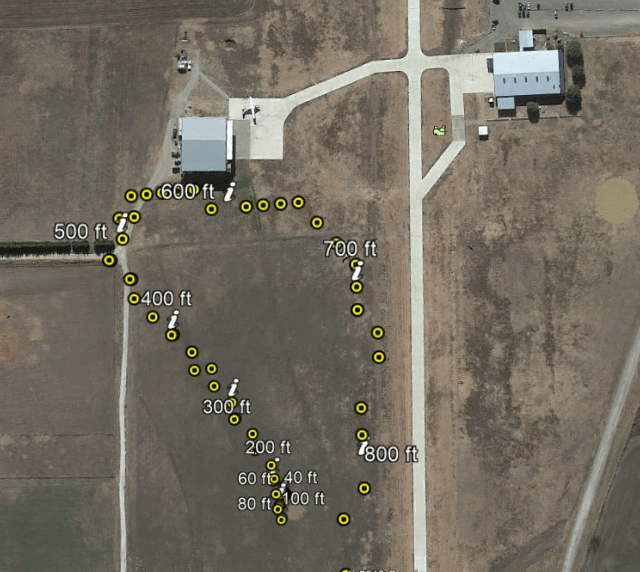
But I learned my lesson. My first training jump (solo, but with instructor holding on to me), I put my watch into “running” workout mode. I got my elevation data. I pulled the standard KML file for the “exercise activity” from my Garmin account; KML, or Keyhole Markup Language, is the format that Google Earth (GE) uses to represent geospatial data. It is a pretty common standard these days and used in more than just GE. Even with the elevation data, the track was snapped down to the earth surface, not giving me a good view of what my flight path really looked like. I did a quick “monkey patch” of the KML file to try and get elevation used for display of the flight path. A “monkey patch” is when you hand edit a file or piece of data to get what you want; it is pretty blunt force, but it does get the job done and is perfect when you are prototyping and digitally exploring. My monkey patch worked – I was on the road to being happy. My very first training jump, I overshot my landing spot by more than I was wanting. Reviewing the track in GE made it very clear why. I had turned way too early on approach. I realized that I was not looking straight down between my feet for my turn point, but rather ahead at an angle. This was already paying off.

The next thing was to automate the process, as having to do it by hand every time would be a PITA. So I started with writing a program to parse the positions (with their timestamps) out of the original KML file. Once that was done, I wrote an output generator to build a more friendly KML file to view in GE. At this point, you might be thinking “So what, you already had that with your monkey patch”. This was just getting the basic gozintas and gozoutas setup (data in and data out – some slang I picked up from one of the many grumpy experienced programmers I’ve had the fortune to learn from on my way to being a grumpy programmer).
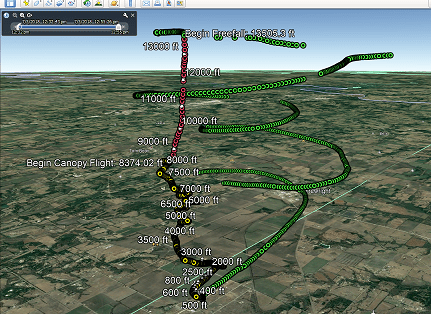
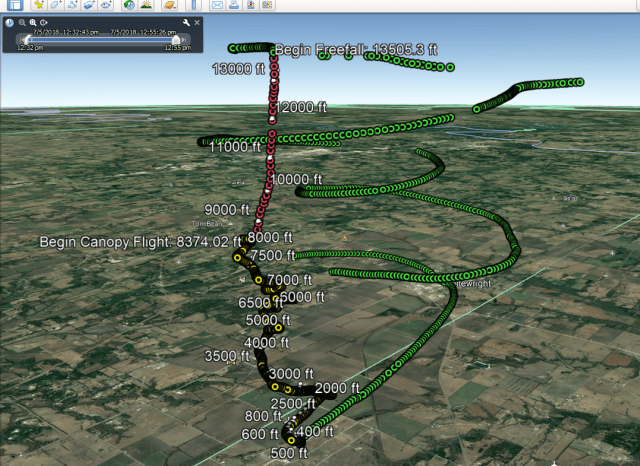
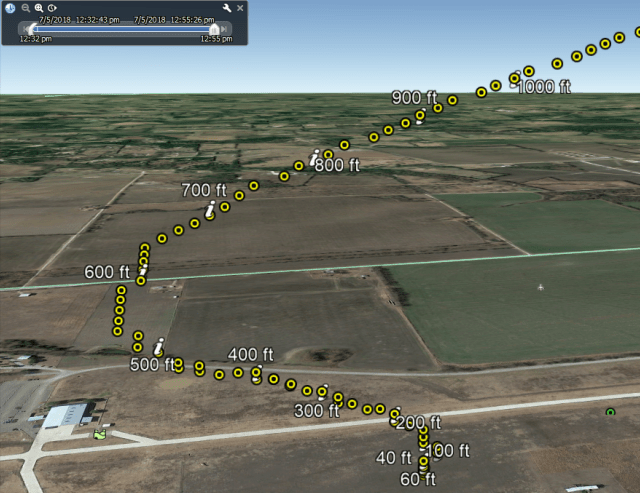
It was now time to do some data processing. First, I was putting my watch in exercise mode long before I ever queued up to get on the plane and well after the jump was done because you shouldn’t let things distract you when it is go time. So I have all these points before and after the jump that are pretty useless. I wrote a crude filter to cut these out. Then I expanded on the filter to use elevation and vertical change to detect: ascent in the airplane, free fall, canopy flight, and finally, my return to terra firma. Then it was time to snazzy up the output. Based on the phase of the jump, I color coded the track: green for ascent, red for free fall, and yellow for canopy flight. I added some altitude annotations (when I went from one phase to another, as well as altitude at intervals).
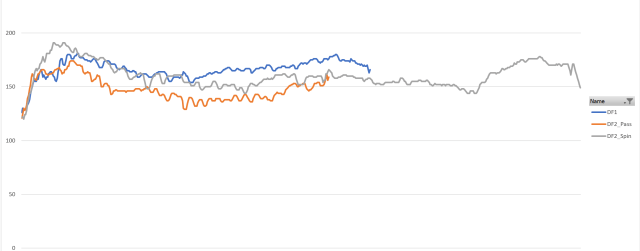
I realized I could use a different file format exported from my Garmin account that included heart rate data, so I wrote a new parser to read the new file type. I was pleased with being able to export the data to a csv file, then importing it into excel. Maybe in the future I’ll build a graph generator/display directly in the application.
All this from a $170 watch meant as an exercise/activity tracker for runners. There are turn-key solutions already out there, but they are much more expensive, and I have to take what I get in terms of features and capability. We’ll see where it goes from here. I’m already adding functionality to store the jump information to a database so I can retrieve it later, as well as adding notes for each jump. Turning it into an electronic logbook for skydives. Again, these already exist, but this one is all my own. I see some algorithms to extract additional data in the cards as well; I just need to find more time.
It’s a great feeling to be able to use technology and a bit of code to solve real world problems. I always suggest to folks that they should learn a little bit of programming, even if it is just writing some fancy macros for excel. I promise it will pay off.

Wow. Well. Writing macros is as close as I’ll get to anything like this. And I actually feel like a little bit of a hero doing that. Lol. Your silver heart rate experience is almost too much for me -ftr.
LikeLiked by 1 person
I expected the silver heart rate to be higher than it was!
LikeLike